Grafana Configure

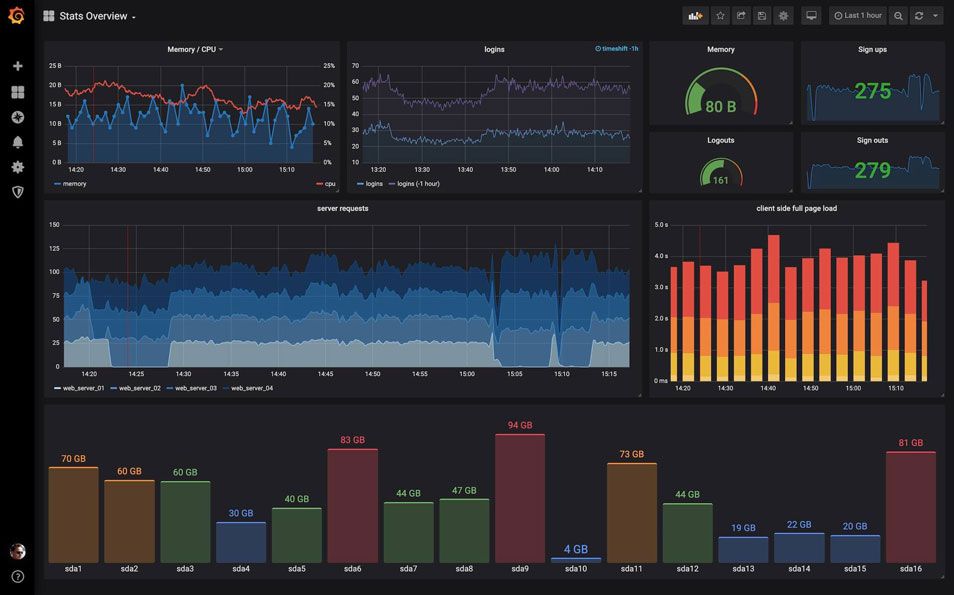
In this post, we will see how we can install Grafana in our Ubuntu Server. Grafana is an open-source data visualization and monitoring tool that can easily be integrated with other tools.
We will install Grafana in our server as a service and not in a container.
We have more than one way to install Grafana:
- By downloading the Linux binary
- By downloading and installing the
.debpackage - By installing from the official repository
We will show the last method, because we don’t have to manually update the package ourselves.
Install from official repository
We can simply, add the Grafana repository to our system and install the new versions when they release with the rest of the packages in our system.
We firstly have to install some dependencies:
Now we can add the Grafana key:
And add the repository for stable releases:
Now we can update the packages, and install grafana:
Start the Server
After the installation, we need to start the grafana-server as the grafana server.
We will start the service with systemd and verify it started:
We can configure the Grafana server to start at boot:
Package Details
When installed as a service, Grafana utilizes the following locations:
- Installs binary to
/usr/sbin/grafana-server - Installs Init.d script to
/etc/init.d/grafana-server - Creates default file (environment vars) to
/etc/default/grafana-server - Installs configuration file to
/etc/grafana/grafana.ini - Installs systemd service (if systemd is available) name
grafana-server.service - The default configuration sets the log file at
/var/log/grafana/grafana.log - The default configuration specifies a SQLite3 db at
/var/lib/grafana/grafana.db - Installs HTML/JS/CSS and other Grafana files at
/usr/share/grafana
Log In
To log in to Grafana for the first time:
- Open your web browser and go to http://localhost:3000/. The default HTTP port that Grafana listens to is
3000unless you have configured a different port. - On the login page, enter
adminfor username and password. - Click Log in. If login is successful, then you will see a prompt to change the password.
- Click OK on the prompt, then change your password
Configuration
Grafana has a number of configuration options that you can specify in a .ini configuration file or specified using environment variables.
Note: You must restart Grafana for any configuration changes to take effect.
Config file locations
Do not change defaults.ini! Grafana defaults are stored in this file. Depending on your OS, make all configuration changes in either custom.ini or grafana.ini.
- Default configuration from
$WORKING_DIR/conf/defaults.ini - Custom configuration from
$WORKING_DIR/conf/custom.ini - The custom configuration file path can be overridden using the
--config parameter
For the Linux installation the configuration file is located at /etc/grafana/grafana.ini and a separate custom.ini is not used. This path is specified in the Grafana init.d script using --config file parameter.
Refer to the Grafana Doc’s Configuration page for every setting and configuration that you want to change.
Secure Configuration
If you want to secure your Grafana installation, by enabling HTTPS and using only authenticated users you can follow the Digital Ocean Guide on How To Install and Secure Grafana on Ubuntu 18.04.