Node-RED Install

In this post, we will see how we can run Node-RED using Docker Containers on our Ubuntu Server. Node-RED is a flow-based development tool for visual programming, for wiring together hardware devices, APIs and online services as part of the Internet of Things.
The light-weight runtime is built on Node.js, taking full advantage of its event-driven, non-blocking model. The flows created in Node-RED are stored using JSON which can be easily imported and exported for sharing with others.
Home Assistant Install

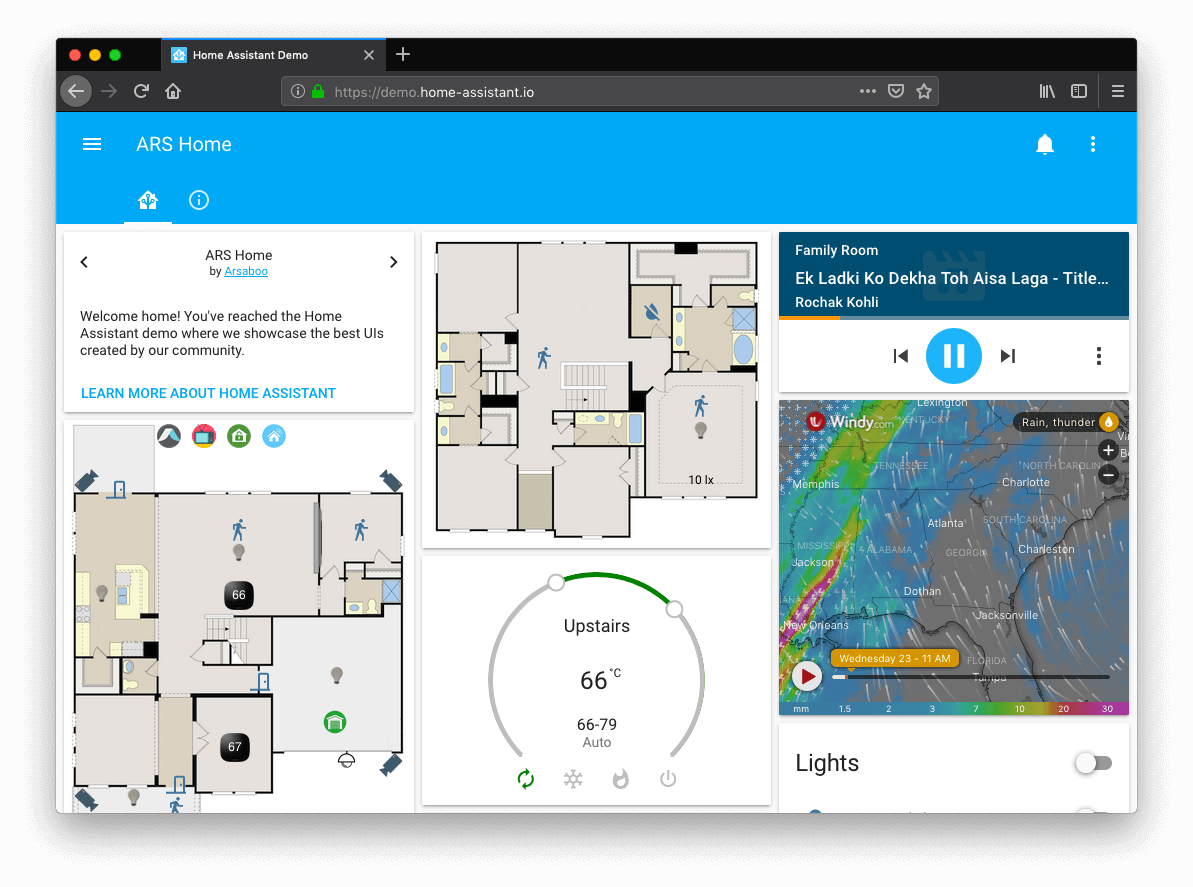
In this post, we will see how we can run Home Assistant using Docker Containers on our Ubuntu Server. Home Assistant is an open source home automation tool that we can run on a local server to integrate with another Smart Home service or sensors and micro-controller.
There are a lot of installations method available, that you can find in the Installation page of Home Assistant, but we will use Docker containers to easily deploy the software.
Grafana Configure

In this post, we will see how we can install Grafana in our Ubuntu Server. Grafana is an open-source data visualization and monitoring tool that can easily be integrated with other tools.
We will install Grafana in our server as a service and not in a container.
We have more than one way to install Grafana:
By downloading the Linux binary By downloading and installing the .deb package By installing from the official repository We will show the last method, because we don’t have to manually update the package ourselves.
InfluxDB Configure

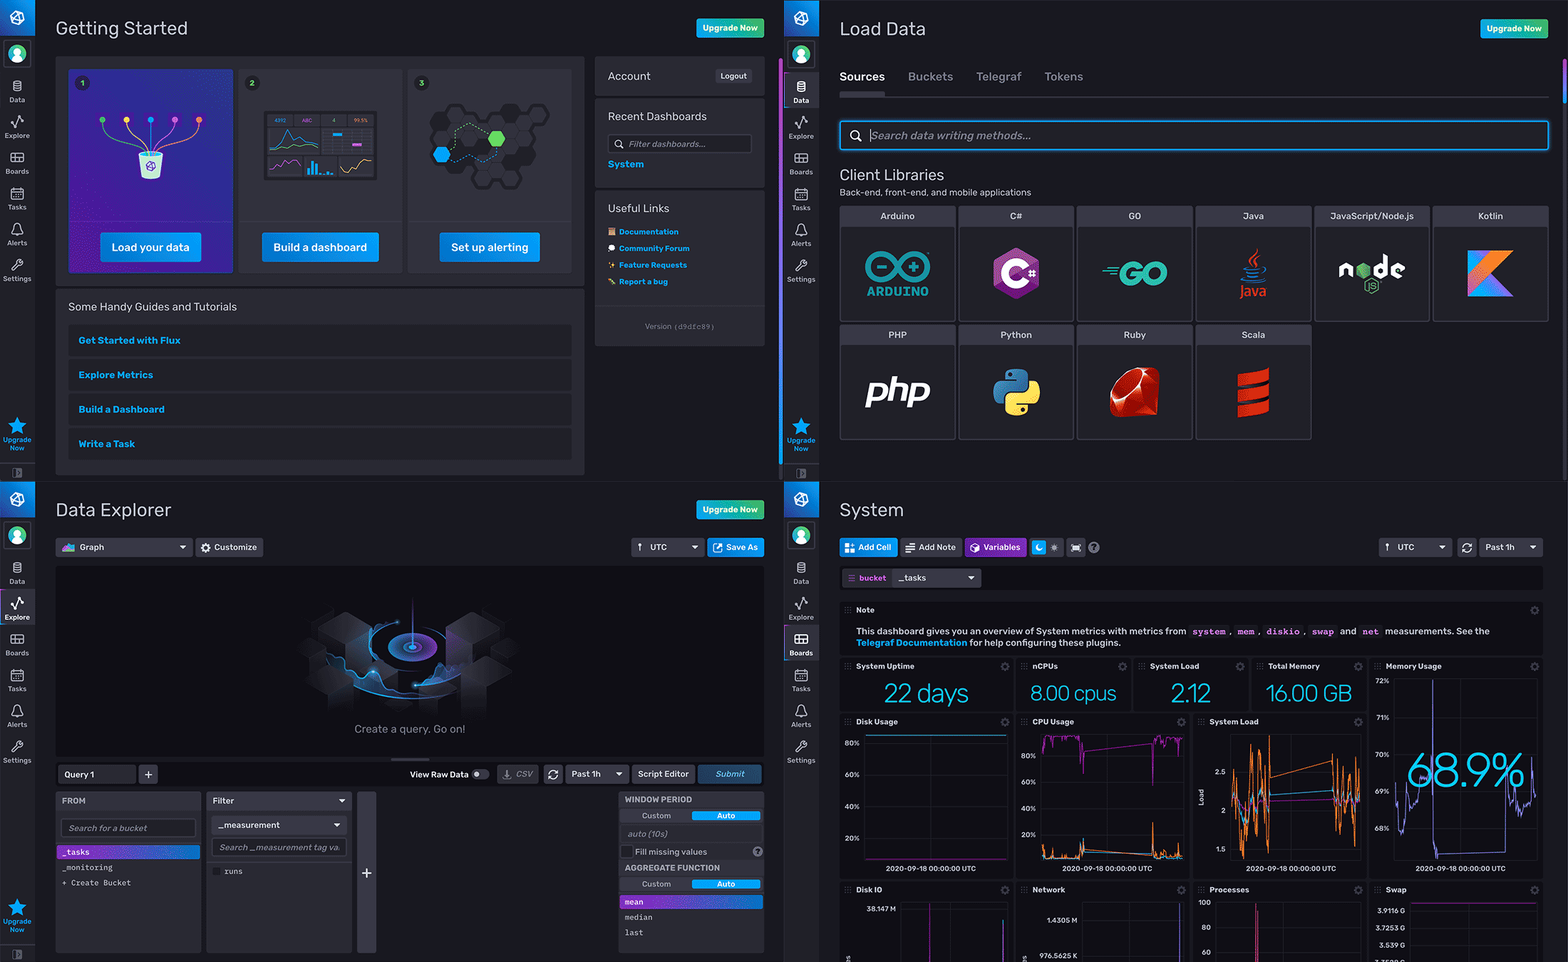
In this post, we will see how we can install the latest version of InfluxDB (ver 2.0) in our Ubuntu Server. With the new version there’s only one thing to download and install and we can avoid installing the TICK Stack (Telegraf, InfluxDB, Chronograf, Kapacitor).
The new version is not a simple time-series database anymore, but also a platform for querying, visualization and data manipulation.
We have more than one way to install InfluxDB 2.
Building a DSL Info Bot with Selenium and Plotly

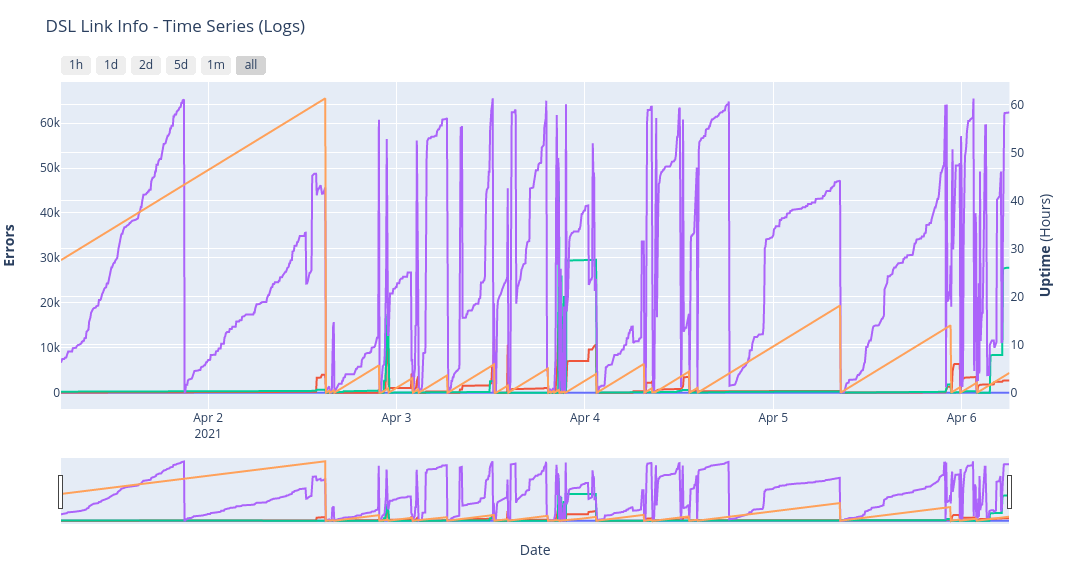
About A python bot, that uses Selenium, in order to automatically access the Router/Modem’s web-based setup page and get DSL Link info. It uses Plotly to create an interactive Plot as an HTML web page.
It also supports the export of the data to an InfluxDB Bucket for further monitoring and visualizing.
Currently gets the following info:
CRC Errors FEC Errors Showtime_start Support for the following Routers/Modems:
ZTE Nova Routers (H267N, H288A, …) The need behind this project, was to monitor my DSL Link information over time, to correlate with various internet outages or sudden internet speed issues.
Building a full stack application for finding Movies on Streaming Platforms with the SERN stack (SQL, Express, React, Node)

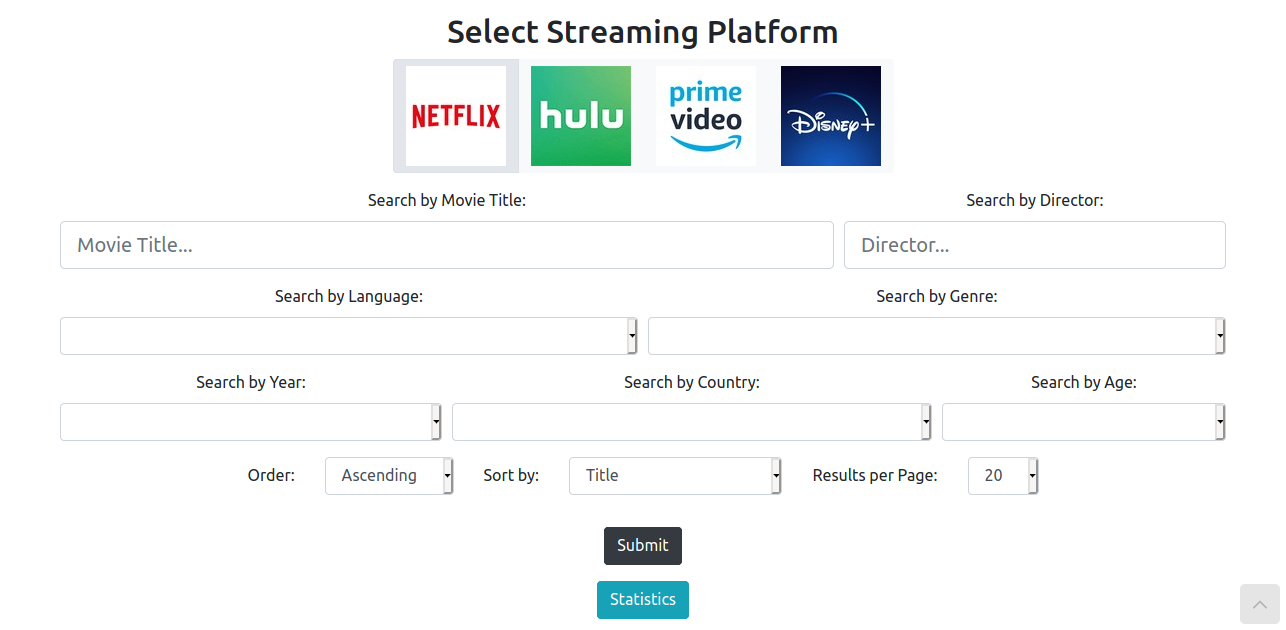
About The purpose of this project is to create a Web Application in which a user can search movies to watch in different streaming platforms (Netflix, Hulu, Amazon Prime, Disney+).
The user can filter the results with different criteria and choose to search on any number of the streaming platforms in order to find the desired movies. Also, some statistics are provided about the number of movies that are available on each platform in the form of a pie chart.